![people element logooo.png]](https://20709424.hs-sites.com/hs-fs/hubfs/people%20element%20logooo.png?height=50&name=people%20element%20logooo.png)
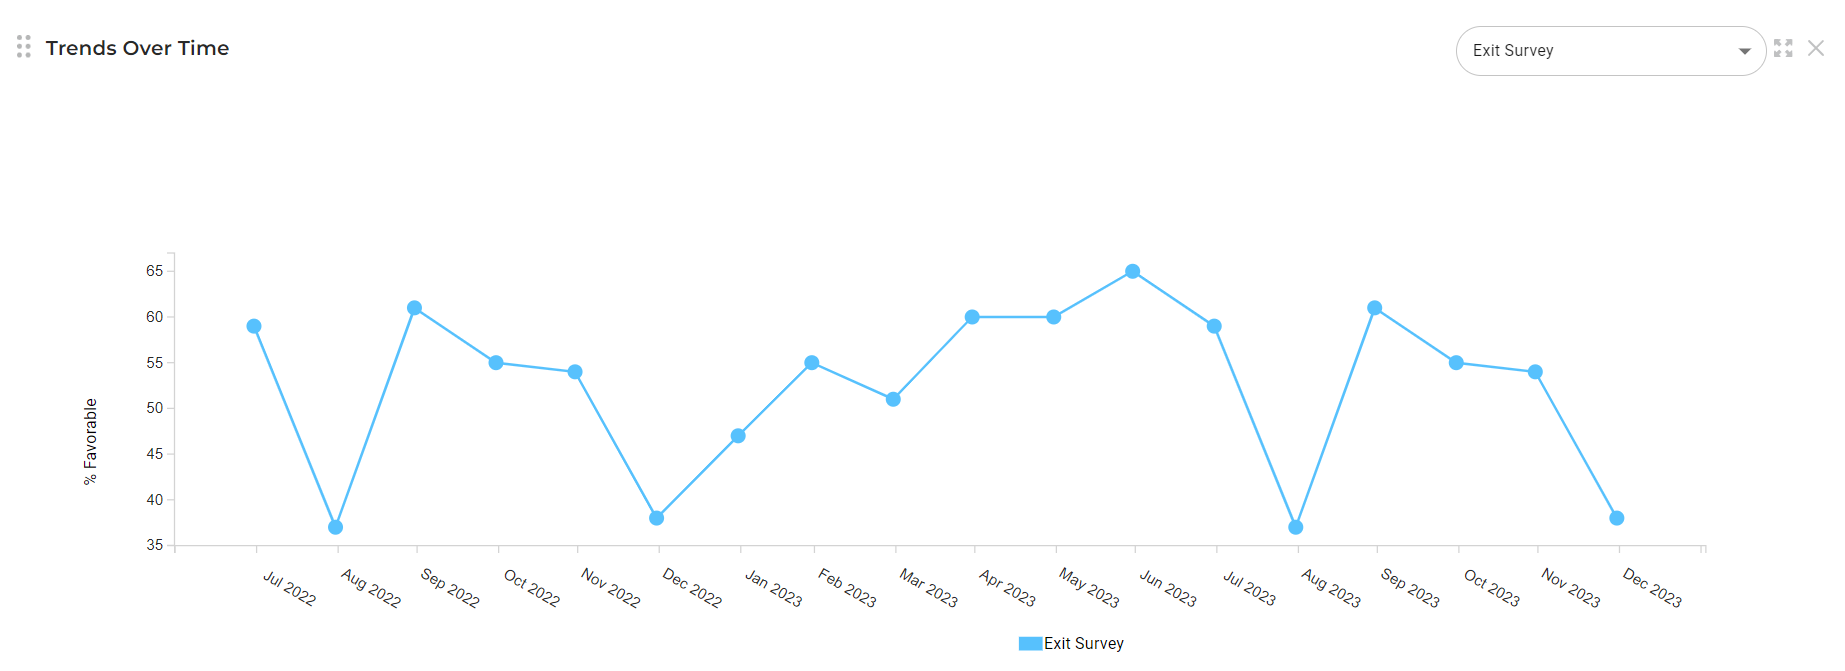
Track your overall favorability score monthly with the Trends Over Time chart. Hover over the monthly data point to view that months favorability score and number of responses. You can view up to the last 18 months worth of data from the end date selected in your data filters for the selected survey(s).
Use the survey dropdown menu to add additional survey data points into your chart. You can view data for up to 10 different surveys at a time.