![people element logooo.png]](https://20709424.hs-sites.com/hs-fs/hubfs/people%20element%20logooo.png?height=50&name=people%20element%20logooo.png)
This widget displays results for matrix-style questions included in your survey. If there are no matrix questions included in your selected survey, this widget will not display. A bar graph shows the percent of responses of each answer choice by factor. The answer key is displayed below the graph for reference. Hover over each bar to get a table view of responses for a specific factor.
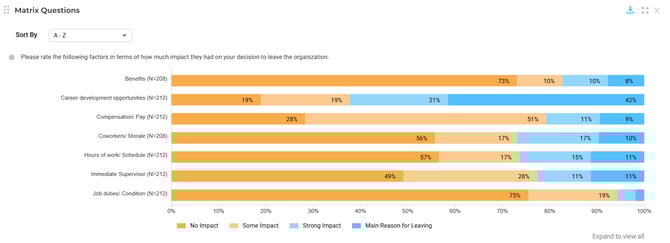
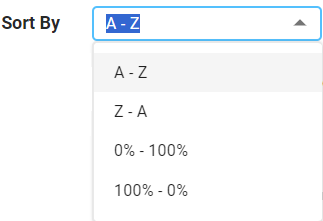
Sort your matrix factors/sub questions from A-Z or Z-A or sort the x-axis from 0-100% or 100-0%. When sorting 0%-100%, factors will sort with the highest percent of responses to the first scale item at the top of the list. When sorting 100%-0%, factors will sort with the lowest percent of responses to the first scale option at the top of the list.
To view all available data, you may need to expand the widget. Simply click the expand icon located in the top right corner to transition to full-page view. If you wish to remove the chart from your display, click the close icon. To export the data to Excel, just click the blue download button.
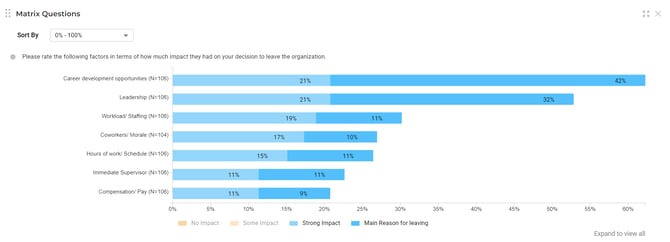
You can hide data in your chart by clicking on the answer key option you wish to hide. The answer key options unselected will remain in view. To unhide a data point, simply click on the answer key option “greyed out” for it to reappear.
When data is hidden, sorting by 0%-100% will order the remaining data by highest percentage to lowest percentage of total responses. (see below as example) When sorting 100%-0%, the remaining data will sort lowest percentage to highest percentage of total responses.
To learn how and when to use a Matrix question, click here