![people element logooo.png]](https://20709424.hs-sites.com/hs-fs/hubfs/people%20element%20logooo.png?height=50&name=people%20element%20logooo.png)
The People Element engagement index is a scale measuring the level of commitment, effort, connection, and advocacy a person feels towards their company. The six questions that make up our engagement index are:
-
I am motivated to go beyond what is normally expected of me to help the organization be successful
-
I don’t consider looking for a new job elsewhere
-
I feel proud to work for this organization
-
I plan to be here at least 1 year from now
-
I would recommend this organization as a good place to work
-
My work gives me a sense of personal accomplishment
The engagement index calculation and charts are only available for engagement surveys using the engagement template and the six engagement index questions with a 1-5 Likert scale. These engagement index questions must be selected from the question library and cannot be created as custom questions.
Dashboard
On your dashboard, the Engaged Employees key metric provides a high level overview of the percentage of employees that are engaged based on the responses to the six engagement index questions. The gauge reflects an engagement percentage from 0-100%.
A green or red bubble indicates an increase or decrease in percentage points since the last engagement survey. The last engagement survey is determined by the most recent end date of an engagement template survey. The blue people icon shows the number of people who are engaged.

In the Engagement Benchmark key metric, we want to make it easy to understand how your employee engagement levels compare to other organizations. We use all customer engagement data for the previous year to create percentiles to show where your engagement score falls within the global benchmark.
The median engagement score, or 50th percentile, is based on 60% engaged employees. If you have an engagement score of 60% this means your score is higher than 50% of other companies.

Report
Your Engagement report includes your overall engagement score and the percentage of people in each level of engagement. To view engagement levels for a specific demographic group, use the view by dropdown menu.
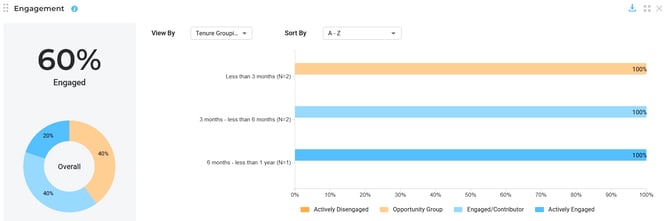
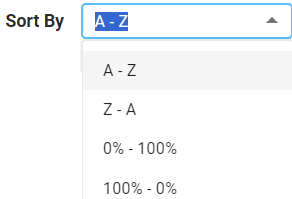
Sort your demographic items from A-Z or Z-A or sort the x-axis from 0%-100% or 100%-0%. When sorting 0%-100%, factors will sort by the actively disengaged group from high to low. When sorting 100%-0%, factors will sort by the actively disengaged group from low to high.
If data is hidden, sorting by 0%-100% will order the remaining data by highest percentage to lowest percentage of total responses. When sorting 100%-0%, the remaining data will sort lowest percentage to highest percentage of total responses.
To view all available data, you may need to expand the widget. Simply click the expand icon located in the top right corner to transition to full-page view. If you wish to remove the chart from your display, click the close icon. To export the data to Excel, just click the blue download button.
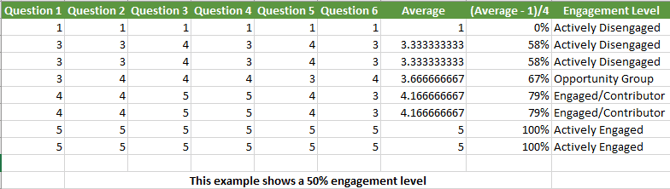
Engagement scores can be found using the below calculation for each respondent that answered all six of the engagement index questions. If a respondent did not answer one of the questions or marked NA (0), remove them from the calculation.
-
Find the average of the six engagement index questions for each respondent (SUM / 6)
-
Take the (Average - 1)/4 to get a percent value from 0 to 100%, this is your index score.
-
Use the index score to determine each respondents engagement level.
-
Overall engagement % is the percent of respondents that fall into the Engaged/Contributor and Actively Engaged groups.
| Index Score | Engagement Level |
| 91 - 100% | Actively Engaged |
| 76 - 90% | Engaged/Contributor |
| 60 - 75% | Opportunity Group |
| 0 - 59% | Actively Disengaged |
See our Manager Action Guide - Engagement for steps on taking action to your engagement survey results